WAR: What Is It Good For?
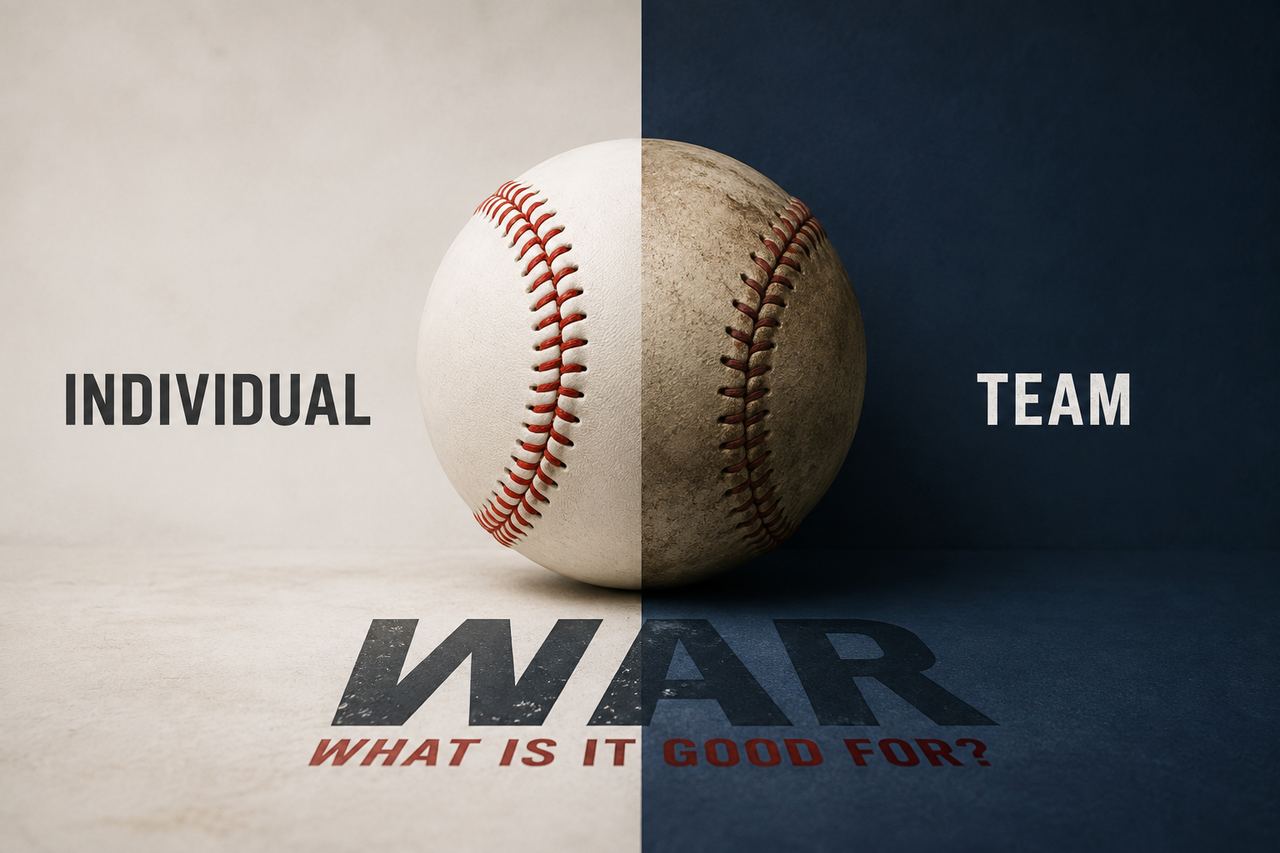
Baseball built a statistic to measure individual value. Somewhere along the way we started asking it to explain winning, greatness and championships. Those may not be the same thing.
By Erik Chambers
Founder, Creator & Editorial Architect
The Standard take
The Standard
Key Findings
- The word WAR gets used as though Major League Baseball issued one official formula and everybody agreed never to touch it again.
- The R in WAR causes another common misunderstanding.
- FanGraphs uses positional adjustments because average defense at shortstop is not treated as equivalent to average defense at first base or designated hitter.
Baseball built a statistic to estimate individual value. Somewhere along the way, we started asking it to settle arguments about winning, greatness, MVPs and championships. That is considerably more work than one decimal point should be expected to handle.
There are statistics that enter a sport's vocabulary and statistics that eventually begin running the meeting. WAR — Wins Above Replacement — has become the second kind.
Turn on baseball television, read an MVP argument or wander into baseball social media and eventually somebody will drop a WAR total like a judge putting down the gavel. One player has the bigger number. Apparently everybody can go home.
Except we should probably understand the number before letting it close the courthouse.
FanGraphs describes WAR as a framework for estimating how many wins a player contributes above the value expected from a replacement-level alternative. Its position-player model combines batting, baserunning, fielding, positional adjustment, league adjustment and replacement runs before converting the result into wins. FanGraphs Sabermetrics Library — WAR.
That is an extraordinary amount of baseball compressed into one number.
It is also why the number should be understood rather than worshipped.
WAR may be one of baseball's strongest tools for estimating individual value. This investigation asks what happens when we begin using that individual-value estimate to answer questions about positions, roster construction, team strength and championships.
Baseball has always loved numbers. What changed is how many parts of the game can now be measured and how sophisticated the models built from those measurements have become.
Batting average once carried enormous explanatory power because it captured something easy to record. Home runs, RBIs, pitcher wins and fielding percentage lived in the same statistical neighborhood. Those numbers were not foolish. They answered questions baseball could reliably ask with the information available at the time.
WAR attempts something much larger.
FanGraphs' position-player framework combines batting runs, baserunning runs and fielding runs above average with positional adjustment, league adjustment and replacement value before converting runs into wins. FanGraphs — Position Player WAR.
Offense + baserunning + defense + position + replacement value, translated into wins.
FanGraphs calculates pitcher WAR differently. Its traditional framework relies heavily on Fielding Independent Pitching, or FIP, which focuses on outcomes such as strikeouts, walks, hit batters and home runs. FanGraphs — Fielding Independent Pitching.
That distinction matters because WAR is not directly observed in the same way a pitch velocity or home run is observed.
WAR is assembled from several components.
Measurements go in. Modeling decisions go in. A replacement baseline goes in. A value estimate comes out.
There Isn't Even One WAR
The word WAR gets used as though Major League Baseball issued one official formula and everybody agreed never to touch it again.
That is not how the statistic works.
FanGraphs publishes fWAR. Baseball-Reference publishes its own WAR implementation, commonly called bWAR or rWAR. Baseball Prospectus uses WARP. These systems share the broad goal of estimating value above replacement while differing in important methodological details. FanGraphs explicitly explains that its WAR figures may differ from Baseball-Reference because the systems make different choices in calculating components of value. FanGraphs WAR documentation.
That is useful information.
It tells us the final decimal is an estimate generated by a particular model rather than a universal physical measurement.
FanGraphs also cautions readers against interpreting small differences in WAR too precisely, particularly because defensive estimates contain meaningful uncertainty. FanGraphs WAR interpretation guide.
So when two elite players sit relatively close together on a WAR leaderboard, the intellectually responsible conclusion is not that the smaller decimal difference represents perfect scientific certainty.
The difference can still be informative.
It simply should be read as part of an estimate rather than as a stopwatch result.
The R in WAR causes another common misunderstanding.
Replacement level does not mean league average.
FanGraphs describes replacement level as roughly the level of performance a club could obtain from readily available talent at minimal acquisition cost, including fringe major leaguers and similar players. FanGraphs — Beginner's Guide to Replacement Level.
This allows WAR to credit playing time and production above that baseline.
It also intentionally removes some organizational context.
A standardized replacement baseline lets the model compare players without making one player's value depend on whether his organization happens to have a stacked Triple-A roster.
FanGraphs uses positional adjustments because average defense at shortstop is not treated as equivalent to average defense at first base or designated hitter.
Its published full-season position values include +7.5 runs for shortstop, +2.5 for center field, -7.5 for each corner-outfield position, -12.5 for first base and -17.5 for designated hitter. The adjustments are prorated according to defensive playing time. FanGraphs — Positional Adjustment.
| Position | Published Full-Season Adjustment |
|---|---|
| Shortstop | +7.5 runs |
| Center Field | +2.5 runs |
| Left Field | -7.5 runs |
| Right Field | -7.5 runs |
| First Base | -12.5 runs |
| Designated Hitter | -17.5 runs |
The underlying idea is logical: defensive positions have different levels of difficulty and scarcity.
But once positional value enters the calculation, the finished WAR total becomes more interesting when we take it apart.
How much came from the bat?
How much came from the glove?
How much came from baserunning?
How much came from playing center field rather than first base?
That brings us directly to Pete Crow-Armstrong.
FanGraphs' current-season combined WAR leaderboard lists Cubs center fielder Pete Crow-Armstrong first in Major League Baseball at the time of this edition. FanGraphs — Current Combined WAR Leaderboard.
Shohei Ohtani appears near the top of that same combined leaderboard while producing value as both a hitter and a pitcher. FanGraphs displays batting WAR and pitching WAR separately before combining the two into total WAR. FanGraphs — Combined WAR Leaderboard.
That creates a fascinating comparison because the players reach their value in radically different ways.
Crow-Armstrong produces conventional position-player value through offense, baserunning, center-field defense, playing time and positional scarcity.
Ohtani creates offensive value while also taking major-league innings as a starting pitcher.
Old defensive statistics often recorded only the end of the play.
Statcast begins earlier.
MLB's Catch Probability model evaluates an outfielder's opportunity using the amount of time available, the distance required and the direction in which the fielder travels. MLB Statcast — Catch Probability.
Outs Above Average then turns those individual opportunities into cumulative defensive credit or debit.
MLB explains that a successful catch on a ball with a 75 percent Catch Probability is worth +0.25 OAA, while failing to convert the same opportunity is worth -0.75. MLB Statcast — Outs Above Average.
That is dramatically more sophisticated than simply counting putouts.
It also means the lazy version of the PCA criticism falls apart immediately.
Center fielders do not receive automatic defensive credit merely because they catch more balls.
The more interesting issue is shared defensive opportunity.
Imagine a ball into left-center.
The left fielder has a realistic route.
The center fielder has a better one.
The center fielder calls him off and records the catch.
The club receives one out.
Statcast evaluates the difficulty of the center fielder's own opportunity. Our additional question is whether modern tracking information can tell us something about the probability that another defender could also have completed the play.
How much elite defense creates outs that otherwise disappear, and how much redistributes playable balls toward the best defender?
That is not an accusation against OAA.
It is a separate question about defensive context.
Positional Opportunity Index
For our analysis, POI would describe how frequently a defender receives realistically convertible opportunities compared with players at the same position.
Inputs could include opportunity volume, estimated difficulty, starting location, distance traveled, direction of movement and spatial overlap with nearby defenders.
The point would not be to replace OAA.
The point would be to add context to the opportunities from which OAA is accumulated.
For our analysis, OADV would ask how a defender's accumulated value looks after opportunity volume and shared-zone context are normalized.
If Crow-Armstrong remains dominant after normalization, his defensive case becomes stronger.
If the gap changes materially, that would tell us something about the role of opportunity distribution.
Either outcome would be useful.
The Ohtani Roster Question
Ohtani stresses the framework in a completely different way.
FanGraphs can credit his offense.
It can credit his pitching.
Those components can be combined into total WAR. FanGraphs — Combined WAR Leaderboard.
Our question is whether performing two substantial baseball roles in one roster spot creates a separate kind of organizational value that deserves to be studied.
That is not the same thing as assuming such value exists.
Roster Compression Value
For our analysis, RCV would test whether one player filling multiple legitimate roles changes the value available elsewhere on an active roster.
Possible areas of examination include bench flexibility, bullpen configuration, replacement avoidance and the quality of the roster spot that becomes available elsewhere.
If the effect proves negligible after accounting for existing batting and pitching WAR, we discard it.
Something feeling valuable is not evidence that it creates additional wins.
Show Us the Ingredients
One of the easiest ways to improve public understanding may be to stop presenting WAR only as a finished total.
Show the anatomy of the number.
WAR-C would display the major components contributing to a player's finished WAR so readers can see whether his estimated value is being driven primarily by offense, defense, baserunning, position, pitching or replacement value.
An elite center fielder and an equally valuable designated hitter can arrive at similar headline WAR totals by completely different routes.
Understanding the route makes the comparison better.
One of the easiest ways to misuse WAR is to move silently from individual value to team destiny.
WAR evaluates the individual relative to replacement level.
It does not put the quality of every teammate into that player's personal number. FanGraphs' published WAR methodology is specifically constructed around the player's own estimated contribution above replacement. FanGraphs WAR documentation.
That means an elite player can accumulate enormous WAR on a mediocre team without creating any contradiction.
The player can be excellent.
The roster can still have twelve holes.
Baseball has always been thoughtful enough to provide both situations simultaneously.
Imagine two clubs.
One has a transcendent superstar surrounded by several replacement-level roster spots.
The other has no single player quite as dominant, but positive value is distributed throughout the lineup and rotation.
Which structure tracks winning more closely?
That is a team question WAR data can help us investigate.
WCI would describe how heavily a club's aggregate player value is concentrated in its best player, top three players and top five players.
WAR Density would describe how broadly positive value is distributed across important roster positions.
For the team-level portion of this investigation, we plan to compare winning percentage with several different representations of WAR rather than assuming one player's total should explain a club.
| Measure | Question Being Tested |
|---|---|
| Best Player WAR | How strongly does one superstar track team success? |
| Top-Three WAR | Does a star core improve the relationship? |
| Top-Five WAR | Does broader high-level production matter more? |
| Total Team WAR | How strongly does aggregate player value track winning? |
| WAR Concentration | Does extreme dependence on a few players change the relationship? |
| WAR Density | Does the absence of low-value roster holes add explanatory power? |
Our expectation is that aggregate and distributed value will explain team performance better than the WAR of the single highest player.
That is our expectation, not our result.
The calculation gets the final word.
Major League Baseball played a 60-game regular-season schedule in 2020 rather than the standard 162-game schedule. MLB — Shortened-Season Documentation.
MLB and the MLB Players Association also expanded that postseason to 16 clubs, eight from each league. MLB / MLBPA — Expanded Postseason Documentation.
Because both the schedule length and postseason structure differed from the surrounding seasons, Second City Standard separates that season from the primary normal-season counting-stat comparison. The underlying league-format differences are documented by MLB. MLB schedule documentation MLB postseason documentation.
SCS may also run a separate cross-check that restores the exceptional season to the sample so readers can see whether its inclusion materially changes the result.
If that cross-check is published, the official recorded WAR totals will be used without extrapolating the shortened schedule into hypothetical full-season totals.
The purpose is simple: keep the primary comparison consistent while still showing readers whether the unusual season changes the conclusion.
Baseball Has Entered the Sensor Era
This investigation is not an argument against analytics.
It is an argument for understanding them.
Statcast publicly tracks and derives metrics involving exit velocity, sprint speed, Catch Probability, Outs Above Average and numerous other components of modern performance analysis. Baseball Savant — Statcast.
The sport has moved from recording only what happened toward estimating what was likely to happen given the conditions of the play.
Catch Probability illustrates the change perfectly. A catch is no longer treated merely as catch or no catch. MLB evaluates the opportunity using time, distance and direction. MLB Statcast — Catch Probability.
That is an enormous analytical improvement.
It also means modern fans have to learn a new habit.
Precision is not certainty.
A number displayed to one decimal place can still contain assumptions and uncertainty beneath the surface.
Second City Standard is not going to invent a collection of acronyms and then spend the rest of the investigation protecting them from reality.
POI gets discarded if it adds no useful context beyond the opportunity information already captured by Statcast.
OADV gets discarded if normalization adds no meaningful information.
RCV gets discarded if roster compression creates no measurable effect beyond value already captured by batting and pitching WAR.
WAR Concentration gets discarded if it does not improve our understanding of team success.
WAR Density gets discarded if total team WAR already answers the same question just as well.
If Pete Crow-Armstrong looks even better after the additional testing, we publish that.
If Ohtani's two-way roster effect disappears once everything is controlled properly, we publish that.
If the entire theory turns into a smoking crater in Excel, we publish that too.
A metric that cannot lose is not a metric. It is branding.
WAR forces baseball to account for value that older headline statistics routinely missed.
It values walks.
It incorporates baserunning.
It evaluates defense beyond errors.
It recognizes that different defensive positions carry different responsibilities.
It includes playing time above replacement level.
It creates a common framework in which different kinds of baseball contribution can be compared.
FanGraphs itself recommends treating WAR as an estimate rather than reading small decimal differences as perfectly precise measurements. FanGraphs WAR documentation.
That may be the lesson hiding in plain sight.
The problem is not that WAR is too sophisticated.
The problem is that our conversations about WAR are often not sophisticated enough.
Pete Crow-Armstrong is almost a laboratory-built modern position player.
He can contribute with the bat.
He can run.
He plays center field.
Modern tracking systems can quantify much of his defensive range.
Ohtani is the opposite kind of stress test.
He combines offense with starting pitching inside one player.
FanGraphs' current combined leaderboard places Crow-Armstrong first at this stage of the season. FanGraphs — Current WAR Leaderboard.
That does not settle the broader philosophical argument.
It gives us the data point that starts it.
Instead of declaring the model wrong because our eyes find Ohtani's two-way role extraordinary, we can ask exactly how the model values both players.
Take the number apart.
Measure the ingredients.
Test the assumptions.
See what survives.
Research Brief
Primary WAR framework: FanGraphs fWAR is the default framework because this investigation began with the FanGraphs combined leaderboard. Baseball-Reference may be used as an independent comparison, but the two systems are not averaged into a hybrid number.
Defensive evidence: MLB Statcast Catch Probability and Outs Above Average documentation provide the foundation for the center-field analysis.
Primary historical window: SCS plans to compare full-length regular seasons across the modern Statcast era while keeping the shortened exceptional season outside the primary counting-stat sample. Statcast's public tracking era begins in 2015, while MLB documents the exceptional season as a 60-game schedule. Baseball Savant — Statcast MLB — Shortened Season Documentation.
Exceptional-season treatment: The shortened season is separated because its schedule and postseason structure differed materially from the surrounding full seasons. MLB schedule documentation MLB postseason documentation.
SCS-created concepts: POI, OADV, RCV, WAR-C, WCI and WAR Density are editorial analytical proposals introduced for testing. None is presented as an established MLB, FanGraphs, Baseball-Reference or Baseball Prospectus statistic.
Publication rule: SCS will not publish a championship-conversion percentage, postseason-conversion percentage or correlation coefficient as a final finding until the underlying season-by-season dataset has been independently checked.
Confidence: Confidence is high in the published descriptions of WAR construction, positional adjustment, replacement level and Statcast methodology because those descriptions come directly from the organizations maintaining the systems. Confidence has not yet been assigned to the proposed SCS metrics because the tests have not been completed.
The Standard
So we are going to stop asking WAR to be magic and start taking it apart.
We will examine how the number is built.
Separate offense from defense.
Study positional adjustments.
Test shared defensive opportunity.
Test whether two-way roster construction creates value the conventional components do not already capture.
Measure concentrated superstars against deeper rosters.
Compare individual WAR with aggregate team value.
Then compare all of it with actual winning.
And when the data disagrees with what we expected, we publish that too.
That is not an attack on analytics.
That is analytics.
WAR may be one of the best player-value statistics baseball has ever created. FanGraphs itself tells readers to understand it as an estimate with uncertainty rather than a perfectly precise measurement. FanGraphs WAR documentation.
Pete Crow-Armstrong and Shohei Ohtani give us a tremendous opportunity to study the boundaries of the model because they create value in radically different ways.
One looks like the modern position-player model brought to life: offense, speed, premium position and measurable defense.
The other performs jobs baseball normally assigns to separate humans.
WAR currently has an answer.
We want to understand the question that produced it.
WAR: what is it good for?
A lot.
Just not everything.
Sources
Verified fact: Technical descriptions, current leaderboard information and historical league-format information are linked directly to supporting sources.
SCS analysis: Interpretation of how WAR should be used is Second City Standard editorial analysis rather than a claim attributed to FanGraphs, MLB or another outside organization.
Declared method: Decisions about sample construction, exceptional-season treatment and future cross-checks are choices made by Second City Standard for this investigation.
SCS proposed metric: POI, OADV, RCV, WAR-C, WCI and WAR Density are concepts being proposed for testing. No published player result is attributed to them until the calculations are completed and verified.
The Standard: Questioned, measured and argued.
Built By
Editorial Operating System v1.0Creator
Erik Chambers
Architecture
Founder, Creator & Editorial Architect
AI Assisted
No
Human Reviewed
Pending
Evidence Reviewed
Yes
Last Updated
August 26, 2026
Confidence
Evergreen medium/10
Research Status
Living investigation
We do not claim perfection. We promise transparency. Every investigation shows its work — the question, the evidence, the tools, the humans, and the updates.
Editorial Transparency
This article contains a combination of reporting, publicly available research, and editorial analysis.
Analysis and interpretation. Facts are sourced; conclusions are the author's. Evidence before opinion — facts require sources, analysis requires transparency, opinions require labels.
Meet the creator
Erik Chambers
Founder, Creator & Editorial Architect
Erik originated the central idea, directed the investigation, reviewed the evidence, and approved the final published work.
Read the founder profile →Challenge This
We welcome disagreement
A different way to read the evidence. Research that points in another direction. Where specialists diverge.
Loading challenges…
Submit a challenge
Sign in to submit a challenge. All submissions are reviewed before appearing publicly.
Comments
Ask A Question
What would you ask an editor about this piece?
Reader questions feed our coverage map. The most-asked ones become our next investigations.
Continue Exploring
Guided by the evidenceWhere should this take you next?
Part of a cluster
Baseball Value
What is a baseball player actually worth, and who decides?
See the whole clusterWAR: What Is It Good For?
A composite 0–100 measure of how well this investigation meets the Second City Standard. Scores are auditable — every point comes from the criteria below.
Composite
—
of 100
This investigation is queued for editorial scoring. No score has been assigned yet — the absence of a number is not a judgment on the evidence.
The Standard
· Editorial verdictBased on the evidence presented,
Second City Standard believes Baseball built a statistic to measure individual value. Somewhere along the way we started asking it to explain winning, greatness and championships. Those may not be the same thing.
Remaining uncertainty: Awaiting a final written verdict from the editorial desk.
The Standard · Second City Standard
Continue The Investigation
· Never a dead endThis investigation is one thread. Pull the next one — every path below is another investigation, another question, or another discipline applied to the same problem.
One clear idea, once a week.
Get the strongest investigation, one useful tool, and one question worth carrying forward.
No fake urgency. No spam. Leave any time.